BOOM Finance and Economics 15th October 2023
WEEKLY REVIEW -- Sunday -- All previous Editorials are available at LinkedIn and at https://boomfinanceandeconomics.wordpress.com/
FOCUS ON UNITED STATES ECONOMY
US YIELD CURVE IN BETTER SHAPE BUT MORTGAGE RATES AT 23 YEAR HIGH
US REAL M2 MONEY STOCK FALLING
US MORTGAGE DELINQUENCIES AT REASONABLE LEVEL HISTORICALLY
US HOME PRICES STRONG
US FULL TIME EMPLOYMENT AT HISTORICAL HIGHS
OIL PRICES NOT AFFECTED BY MIDDLE EAST UNCERTAINTY
SHARES OF COVID VACCINE MANUFACTURERS CONTINUE FALLING
US YIELD CURVE IN BETTER SHAPE BUT MORTGAGE RATES AT 23 YEAR HIGH
One year ago, in late October, the Yield Curve of US Treasuries from 3 months duration to 30 years duration was flat. By mid-November, it had started to invert with the 30 year bond yield being lower than the 3 month T Bill yield. On 30th November, it was clearly inverted. And in January of 2023, there was no doubt at all. The curve was inverted significantly and becoming more so almost every day.
During April, May, June and July of this year, the steepness of the inversion increased slowly but steadily. However, during August, the long term yields slowly began rising which reduced the inverted shape of the whole curve. And since then to present date, the process has slowly continued.
Yield Curve Inversion is regarded as one of the most alarming warning signs in economic theory. Although the curve is still inverted, it is much less so than it was throughout June and July. The danger of Yield Curve Inversion appears to be slowly unwinding.
Since August, the 30 Year Treasury Yield has increased from 3.9 % to 4.9 %. The 10 Year Yield has increased from 4.0 % to 4.7 %. The 10 year yield largely determines mortgage interest rates in the US.
The average rate on a 30-year fixed mortgage has now reached 7.57 %. That is the highest level in 23 years. The previous week's average rate was 7.49 %. This is the fifth consecutive week of mortgage interest rate rises.
Freddie Mac’s Chief Economist was reported as saying -- “The good news is that the economy and incomes continue to grow at a solid pace, but the housing market remains fraught with significant affordability constraints. As a result, purchase demand remains at a three-decade low.”
If housing market demand stays low, then (obviously) the demand for housing bank loans stays low. The net effect of that is that the volume of fresh new credit money creation potentially becomes slowly less than the amount of money being drained from the total money stock by loan repayments. The US economy can withstand such a dynamic for some time but will eventually start shrinking if the effect persists and accelerates. Then the economy must contract as the money stock contracts.
It is just like a garden that needs watering regularly. If a drought occurs, the garden can persist for some time in a steady state. However, over time, the plants will begin to die if the supply of fresh water is insufficient compared to the rate of reduction in the water stock contained in the root system.
No garden can survive in a persistent drought. And no economy can avoid contraction (recession) if the supply of fresh new credit money is in persistent decline. The economic garden needs to be continually renewed with fresh new money. If that does not happen, then the total stock of money falls and the economic garden stops growing. Recession is inevitable in such a situation.
US REAL M2 MONEY STOCK FALLING
We can observe all of this by looking at the change in absolute M2 Money Supply. However, a better and more sensitive methodology is to watch the change in Real M2 Money Supply (M2 adjusted for changes in Consumer Price Index CPI).
M2 is the US Federal Reserve's estimate of the total money supply including all of the cash people have on hand plus all of the money deposited in checking accounts, savings accounts, and other short-term saving vehicles such as certificates of deposit (CDs). Retirement account balances and time deposits above $100,000 are omitted from M2. Fresh new money created when a commercial bank makes a loan ends up instantly as a deposit. That’s obvious if you think about it.
Let’s look at the Real M2 Money Stock figures for the United States – since the Global Financial Crisis of 2008 (which triggered a long US recession and a responsive surge in money supply from the QE policy of the Federal Reserve (Quantitative Easing). Readers will note the recent persistent decline in Real Money Stock which began in January 2022.
If this downtrend in Real M2 Money Stock continues, then the US economy may enter a recession. The recent improvement in the Treasury Yield curve is a positive event. However, the persistence of decline in Real M2 Money Stock is of concern and must be watched closely. BOOM is not too concerned by this (yet).
US MORTGAGE DELINQUENCIES AT REASONABLE LEVELS HISTORICALLY
The large US banks which have large mortgage books appear to be performing well. JP Morgan shares rose 2% during the week, Wells Fargo gained 3.2 % and Citigroup surged 2.12 % after beating expectations on both earnings and revenue. This suggests that the default rate on their mortgage books is not at a concerning level.
The recently published graphs for Delinquent Mortgages from the National Mortgage Database is reassuring. It puts the current situation into a long term perspective. However, please note that the last plot on the graphs is for March.
Three states have Mortgage Delinquency rates above 2 % (30 – 89 days) -- West Virginia, Louisiana, Mississippi. But all other states are below that level with many, especially in the western states, being below 1 %.
The National Mortgage Database is a joint project of the Federal Housing Finance Agency and the Consumer Finance Protection Bureau.
The second graph showing Mortgage delinquencies for more than 90 days is also important to understand the current situation in a historical context.
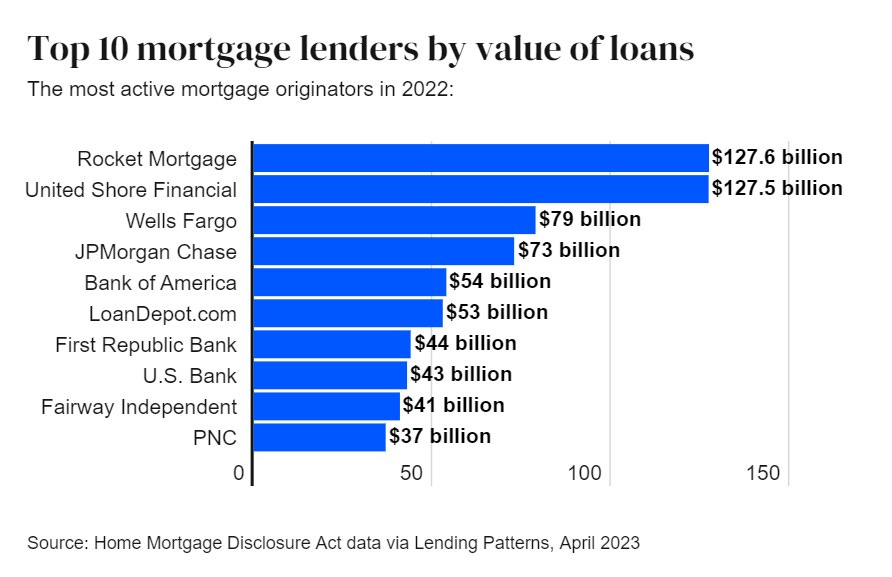
The Top 10 Mortgage Lenders in the USA – by Value of Loans —from Bankrate.com
US HOME PRICES STRONG
The other reassuring aspect of the US economy is the strength in home prices. BOOM predicted this 6 months ago. On 16th April 2023, BOOM wrote -- “This suggests that US house prices may soon begin to rise in price”. At the time, nobody was making such statements. However, the Case Schiller National Home Price Index is following BOOM’s forecast.
According to the latest data from Case Schiller, US home prices rose for the 5th straight month in July jumping 0.9% Month on Month and shifting into the green (+0.1%) on a year-over-year basis for the first time since February.
On home prices, Craig Lazzara, managing director at S&P Dow Jones Indices, said in a statement recently --
“On a year-to-date basis, the National Composite has risen 5.3%, which is well above the median full calendar year increase in more than 35 years of data. Although the market’s gains could be truncated by increases in mortgage rates or by general economic weakness, the breadth and strength of this month’s report are consistent with an optimistic view of future results”.
US FULL TIME EMPLOYMENT AT HISTORICAL HIGHS
US full time employment readings are close to all time highs.
OIL PRICES NOT AFFECTED BY MIDDLE EAST UNCERTAINTY
Many commentators have predicted a surge in oil and other energy prices from last week’s Middle East turmoil. However, Israel and the Gaza strip are not central to energy prices in the Gulf states.
The price of West Texas Light Crude rose over the last week by 5.92 %. That sounds significant. However, when looked at in a 5 year price chart, such a price rise is well within Weekly price ranges.
5 Year Chart
Brent Crude rose by 7.57 % last week which also sounds alarming. However, again, when looked at in a 5 year price chart, such a price rise is well within Weekly price ranges.
5 Year Chart
SHARES OF COVID VACCINE MANUFACTURERS CONTINUE FALLING
BOOM has covered the whole Covid “vaccines” fiasco very closely. Regular readers will be familiar with BOOM’s extensive analyses in this matter. It is essentially a pharmaceutical disaster in real time. And the mess just keeps getting bigger.
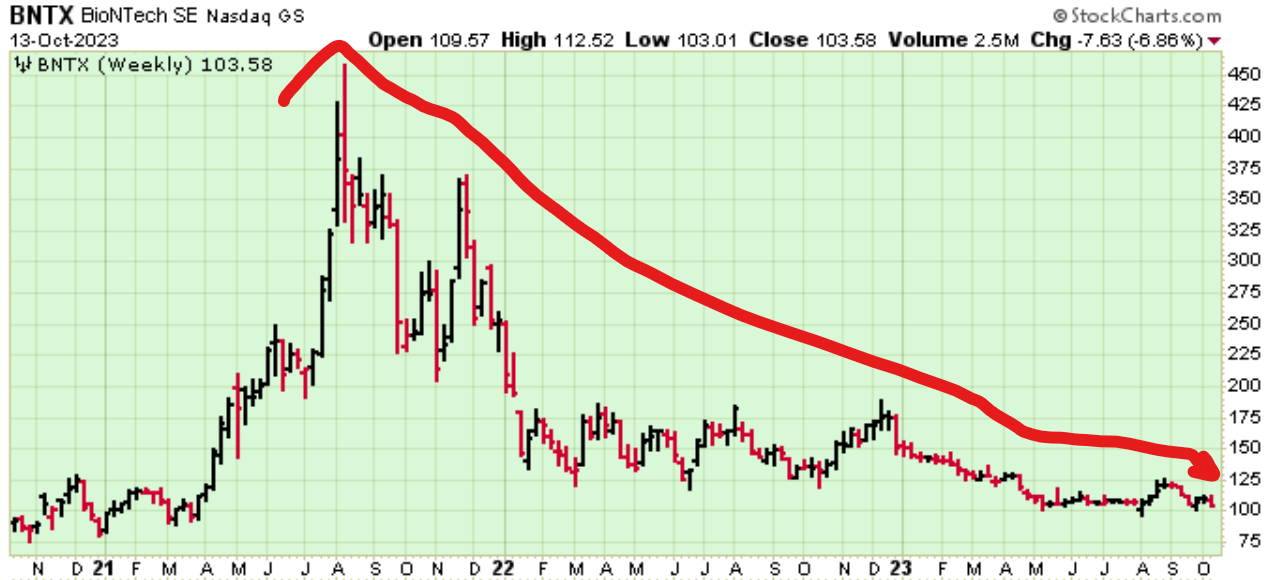
Last week, the share prices of the key 4 manufacturers continued to fall. Pfizer shares fell by 3.08 % on the week. This fall came after Pfizer slashed its revenue and earnings forecasts for the year amid collapsing demand for its Covid products.
Some estimates for current Covid Booster Uptake in the United States are as low as 1.3 %. That is what Dr Peter McCullough, expert Cardiologist in Texas, has stated.
Pfizer Shares NYSE PFE – 3 Years since 2021 – Down 3.08 % last week
Moderna Shares – MRNA – 3 Years since 2021 – Down 5.37 % last week
Novavax – NVAX -- 3 Years since 2021 – Down 7.48 % last week
Biontech SE -- BNTX – 3 Years since 2021 -- Down 6.86 % last week
Disclaimer: All content is presented for educational and/or entertainment purposes only. Under no circumstances should it be mistaken for professional investment advice, nor is it at all intended to be taken as such. The commentary and other contents simply reflect the opinion of the authors alone on the current and future status of the markets and various economies. It is subject to error and change without notice. The presence of a link to a website does not indicate approval or endorsement of that web site or any services, products, or opinions that may be offered by them.
Neither the information nor any opinion expressed constitutes a solicitation to buy or sell any securities nor investments. Do NOT ever purchase any security or investment without doing your own and sufficient research. Neither BOOM Finance and Economics.com nor any of its principals or contributors are under any obligation to update or keep current the information contained herein. The principals and related parties may at times have positions in the securities or investments referred to and may make purchases or sales of these securities and investments while this site is live. The analysis contained is based on both technical and fundamental research.
Although the information contained is derived from sources which are believed to be reliable, they cannot be guaranteed.
Disclosure: We accept no advertising or compensation, and have no material connection to any products, brands, topics or companies mentioned anywhere on the site.
Fair Use Notice: This site contains copyrighted material the use of which has not always been specifically authorized by the copyright owner. We are making such material available in our efforts to advance understanding of issues of economic and social significance. We believe this constitutes a ‘fair use’ of any such copyrighted material as provided for in section 107 of the US Copyright Law. In accordance with Title 17 U.S.C. Section 107, the material on this site is distributed without profit. If you wish to use copyrighted material from this site for purposes of your own that go beyond ‘fair use’, you must obtain permission from the copyright owner.
Subscribe to BOOM Finance and Economics Substack
BOOM has developed a loyal readership which includes many of the world’s most senior economists, central bankers, fund managers and academics.


