


Lies, Damn Lies and Economics - National Debt is Not a Problem - Government Debt to GDP Ratios — What do they Mean? - Net Interest Costs in the Federal Budget - The Power of Italy - Trump's Tariffs
WEEKLY -- On Sunday -- All previous Editorials are available on the Substack Archive Further long term archives are available at LinkedIn and Wordpress https://boomfinanceandeconomics.wordpress.com

MARK TWAIN ON ECONOMICS

LIES, DAMN LIES AND ECONOMICS
Everyone has heard the phrase "Lies, damned lies, and statistics". It is a phrase describing the persuasive power of statistics to bolster weak arguments. It is also sometimes used to caste doubt on statistics being used by an opponent. The phrase was popularised in the United States by the famous 19th century writer, Mark Twain.
The Internet is chock full of finance propaganda and mis-information which creates uncertainty and fear in readers. At its worst, it is deliberate dis-information, designed to be deceptive.
BOOM calls this phenomenon Lies, Damn Lies and Economics. For example, many articles have the common theme of “the US Dollar will collapse and Hyperinflation will break out in the USA …… so buy Gold”. This is an outright lie with no substance. BOOM has been reading such articles for 30 years.
BOOM cannot imagine any scenario where that sequence of events could take place. Global US Dollar Dominance in trade and capital settlements is built on huge Eurodollar volumes (US Dollars offshore). Those US Dollars are mostly not exported from the US. They are created on offshore bank balance sheets when US Dollar denominated loans are made, quite separate from the US Government. And Hyperinflation inside the US (currency collapse) is impossible because the US Government (and the US people) will not tolerate any alternative currency inside their borders.
Many readers ask BOOM what to believe and what not to believe. BOOM’s answer is always the same -- “99 % of the finance and economics articles on the Net are not worth reading. They are junk.”
Sometimes, BOOM will also try to explain that the economics ”profession” does not understand money creation, money dynamics or money destruction. In other words, they simply don’t understand debt and its contractual basis. And they certainly don’t understand the banking system or the difference between public debt and private debt. The importance of money flow (supply) is also often overlooked. That is akin to a farmer or gardener ignoring water. So BOOM does not recommend any finance or economics commentators to be found on the Net (with a few rare exceptions). And BOOM does not recommend any university courses in these subjects either.
NATIONAL DEBT IS NOT A PROBLEM
In regard to public, national government debt, the key thing to understand is that governments don’t go to commercial banks for bank loans. And they don’t offer collateral assets as security. In a sense, they are immortal beings, not fragile humans. They offer securities (issued by the Treasury) which offer a return to investors for a contractually agreed period of time. When that time expires, at the Maturity date, the government returns the capital to the investor. Rarely, a government defaults on the contract. But that is very rare indeed. BOOM explained all of this to Elon Musk in the editorial dated November 3rd, 2024 --
ELON – NATIONS DON’T GO “BANKRUPT” -- TOTAL SOVEREIGN DEBT DEFAULTS (EXCLUDING GREECE) OVER 40 YEARS ARE EQUIVALENT TO JUST 0.1 % OF TOTAL GLOBAL DEBT
Quote: “Nations do not apply for loans from banks to fund their deficit spending. They do not collateralise their assets in bank loans. They issue Treasury Securities to willing investors. In rather rare circumstances, usually in developing nations with unwise economic management, some nations can default on their Bond contracts although this is extremely unlikely for the US Government.
Banks do not put nations into “bankruptcy”. Nations don’t “go bankrupt”.
Over the last 40 years, the total of top 10 Sovereign Debt Defaults was almost $ 600 Billion. However, almost half of that was Greece’s default in March 2012. So the majority of defaults in that time period (excluding Greece) totals approximately $ 330 Billion.
Total Global Debt (public and private) exceeds well over $ 300 TRILLION. So, the sovereign defaults (excluding Greece) over 40 years are equal to just 0.1 % of the total. If we include the Greek fiasco, it is about 0.2 %.”
THE NATIONAL DEBT
Currently, there is much concern circulating about the National Debt of the United States. Elon is not alone in his concern and Trump is equally confused.
The current US National Debt is US$ 36.7 Trillion and that number can be seen growing in real time at The US Debt Clock website and at Debt to the Penny (a website produced by the US Treasury and updated Daily).
To most people, that sounds like an extraordinary amount of Debt. But the fact is that NO NEW MONEY is ever created to invest in government Treasury securities (except in a rare QE program) . It is old money that is used to buy Treasury securities and fund the government’s deficit spending program. That money was created previously, originated in bank loans or in physical cash. So – Government Debt does NOT increase the money supply (except in a rare QE program). Private debt is the main cause of increased money supply. Economists should focus in on excessive private debt creation, not sovereign national debt.
DEBT TO GDP RATIOS — WHAT DO THEY MEAN?
Debt to GDP ratios are often used to scare people when discussions are had about government debt. The US Debt to GDP Ratio is currently around 122%. Sounds scary?
US FEDERAL GOVERNMENT DEBT TO GDP CHART
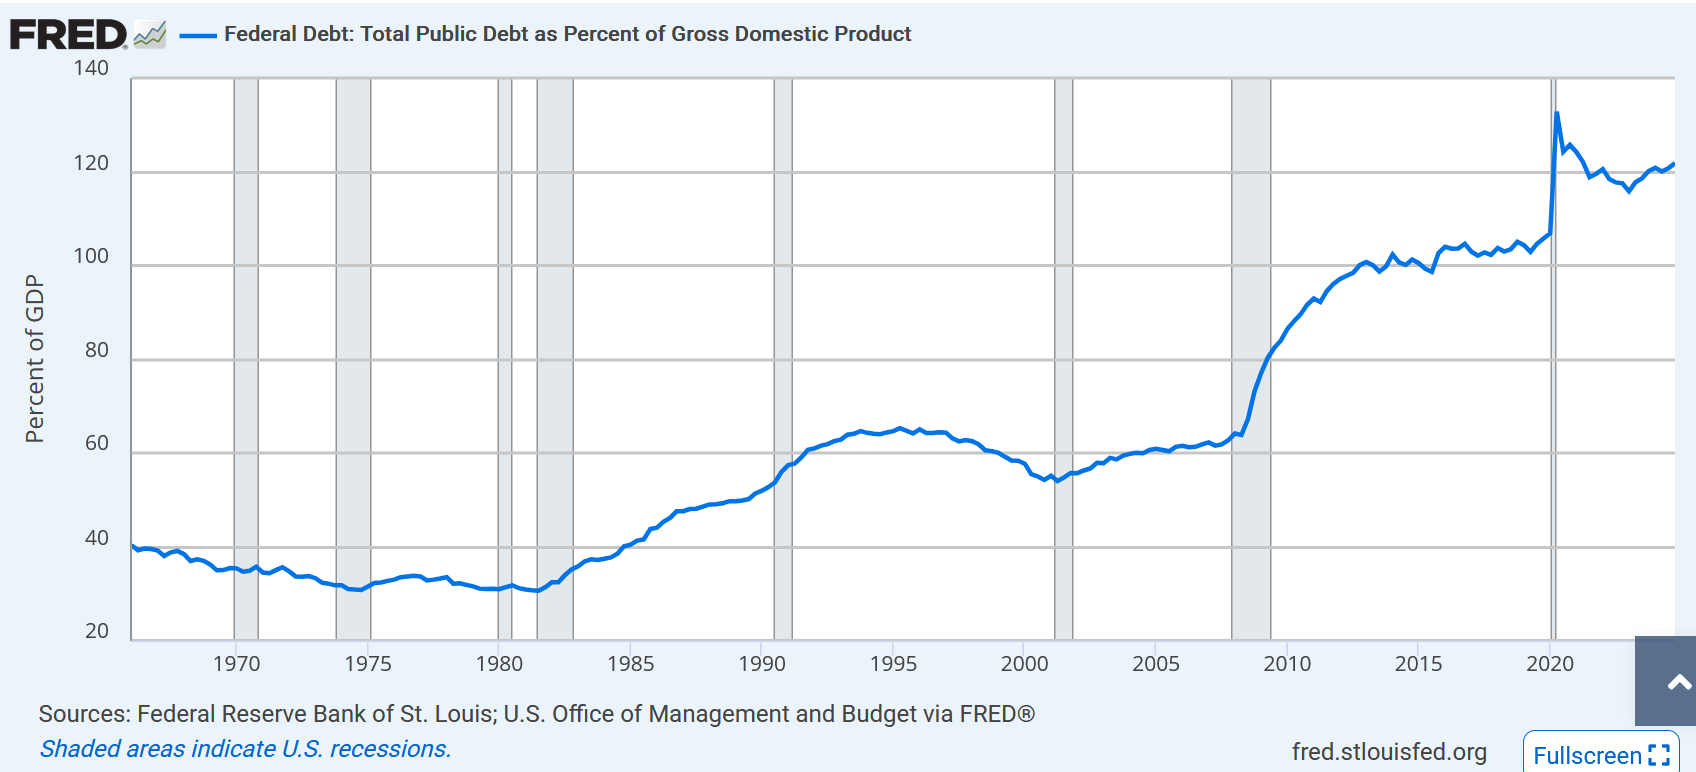
The chart shows the slow progression of higher Debt to GDP Ratios since 1980. It looks worrying to most people who jump to the conclusion that this “cannot continue” and that, therefore, something terrible must soon happen to the US economy. So let’s look at the longer term graph – from 1939. A different picture emerges.
US FEDERAL GOVERNMENT DEBT TO GDP RATIO FROM 1939

Oh that looks better – we are back to where we were in 1946, at the end of the Second World War. Not so scary after all. The US economy survived that “debt crisis” so, surely, it can survive current levels?
The Debt to GDP Ratio slowly declined from 1946 to 1981. One reason for the fall was the fact that Richard Nixon abandoned the link between the US Dollar and the Gold price in 1971 which allowed the Money Supply to expand to meet economic demand. That surge in money supply subsequently allowed increased government Treasury security issuance. Then in the early 1980s, the so-called “oil price crisis”, triggered by the revolution in Iran, caused a very bad global recession. Surging oil prices caused higher CPI inflation and higher interest rates. As GDP fell, the Debt to GDP Ratio naturally rose. Remember, this ratio is a mathematical relationship.
This chart shows the surging inflation during the 1970’s and the Peak of CPI inflation that occurred in 1980.
CPI INFLATION RATE LONG TERM

So US Government Debt to GDP Ratios have increased as the years have rolled by since 1980. It is important to understand that the ratio will (generally) rise if GDP falls or if Debt rises in relation to GDP.
Now let’s look at nations that have a higher Government Debt to GDP Ratios than the US. Let’s look at the three nations in that list that are advanced, First World economies -- Japan, Singapore, Italy. All are greater than the US ratio of 122 %.
TOP 10 DEBT TO GDP RATIOS

Japan Government Debt to GDP Ratio = 255 %
Singapore Government Debt to GDP Ratio = 168 %
Italy Government Debt to GDP Ratio = 135 %
lf we apply the theorem that high Government Debt to GDP ratios are “dangerous” to economies, then the conclusion must be reached that the nations above the USA on this list cannot possibly have a robust economy. Surely the people must have died a horrible death by now from the disease of Government Debt Overdose? According to conventional economic analysis, such mammoth government Debt Overdoses MUST be fatal, surely? But maybe not.
In regard to Japan, Singapore and Italy, BOOM can assure readers that the citizens are all well dressed, extremely well fed, well housed and content with very high standards of living.
So, if the people are content, why panic about their government’s propensity to issue Treasury Securities to willing investors? If investors such as Pension Funds and investment management companies want to buy those securities, where is the problem?
INTEREST COST TO THE US GOVERNMENT
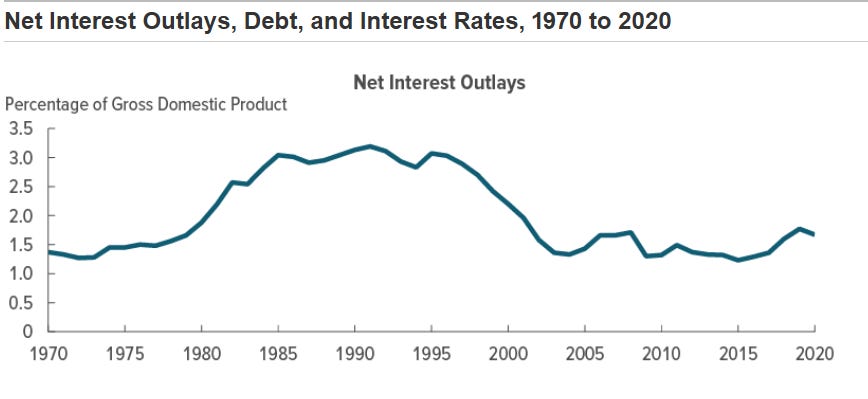
Let’s look at the US Government’s Debt another way. The fact is that Net Interest costs over the last 50 years have averaged 2 %. That is not an alarming interest rate. In fiscal year 2020, the US government’s net outlays for interest totalled $345 Billion, equal to 1.6 percent of gross domestic product (GDP). The interest cost that the government pays on debt held by the public has remained low as a percentage of GDP, even though that debt has risen to historically high levels. So – what is NET interest cost?
Net Interest in the US Federal Budget
The US federal government pays and collects interest in various ways; its net outlays for interest equal the interest it pays minus the interest it receives. Those net outlays primarily comprise the interest paid to holders of the debt that the Department of the Treasury issues to the public. The Treasury also issues debt to trust funds and other government accounts, but the payment of interest to those accounts is an intragovernmental transaction that has no effect on net interest costs or the budget deficit. Other federal accounts also pay and receive interest for a variety of reasons.
US FEDERAL DEBT CHART — the chart shows that $ 7.3 Trillion of current US Federal Debt is held by Intragovernmental Holdings.

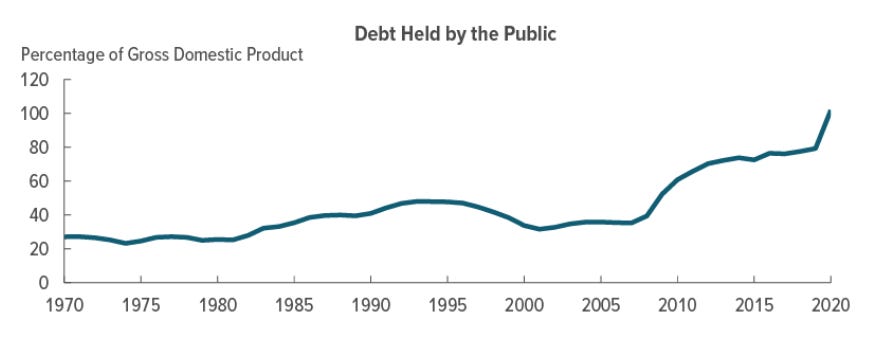
The federal government’s net interest costs largely depend on interest rates and the amount of debt held by the public, which generally consists of bills, notes, bonds, and inflation-protected securities. Other factors, such as the rate of inflation (to which some debt is indexed) and the maturity structure of outstanding securities, also affect interest costs; for example, long-term bonds generally carry higher interest rates than do short-term bills. Interest rates are determined by a combination of market forces, including the supply of Treasury securities, the demand for fixed-income investments, and the policies of the Federal Reserve System.
Debt held by the public is determined largely by cumulative budget deficits, which depend on policy choices about spending and revenues, economic conditions, and other factors. The maturity structure of the debt is determined by the borrowing policies of the Treasury, which issues a variety of short- and long-term debt securities.
That last sentence is critical to understand. Please understand this point.
The Maturity structure of the debt will determine the AVERAGE Net Interest Paid.
NET INTEREST OUTLAYS AS A PERCENTAGE OF GDP 1970 – 2020
DEBT HELD BY THE PUBLIC
INTEREST RATES ON SELECTED SECURITIES
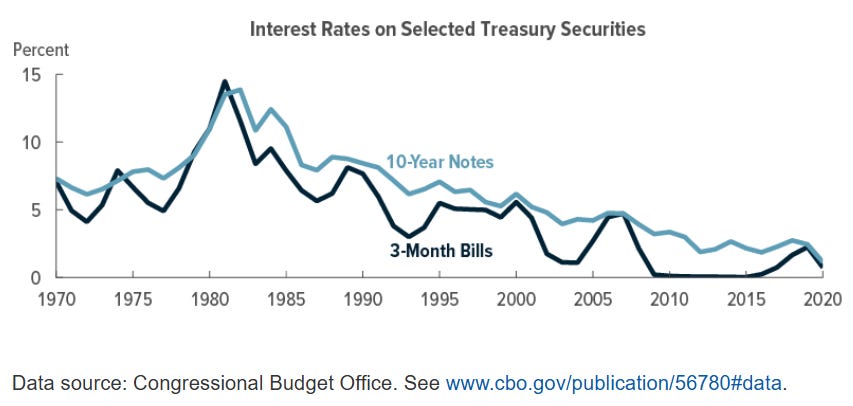
The last chart shows clearly that the interest costs of the US Government debt have fallen dramatically since 1981. The Maturity Structure of the Debt issuance has resulted in an average Net Interest Cost of just 2 % in that time frame. Many more 1, 2 and 3 Month T Bills are issued compared to 10 Year T Note issuance and 30 year T Bond issuance. Many investors see short term Bills as effective Cash Reserves on their investment portfolios.
If US economic circumstances were to improve with better management of the economy, then the investment of funds held in short dated Government T Bills could be switched initially into long term T Bonds (lowering long term interest rates) and then into productive investments in the stock market.
WEIGHTED AVERAGE OF US FEDERAL DEBT PORTFOLIO
The Weighted Average of US Federal Treasuries varies over time but has been around 5 years for long periods. From 1980 to 2021, it averaged 60 months. Currently, it is around 71.8 months (just below 6 years).
Sovereign Debt to GDP Ratios are calculated using all of the debt compared to just one year of GDP which is a distorted view. It would make more sense, surely, to compare 6 years of debt to 6 years of GDP? That reduces the ratio from 122 % to just 20 %. And if you exclude intra-governmental holdings, it reduces further to around 16 %.
16 % doesn’t sound so bad, does it?
HOLDERS OF US FEDERAL DEBT
Who invests in US Treasuries? This chart explains the situation in 2021.

From the tic data, we can see that Foreign Holders currently hold $ 8,817 Billion ($ 8.8 Trillion). That is 24 % of the current total. So, foreign ownership has reduced considerably since 2021.
China holds 2 % and Japan holds 3 %. China cannot “control” the US Federal Debt, cannot “crash” the US Dollar and cannot threaten it in any way. Rapidly selling their holdings would be a financially foolish thing to do and the Chinese are certainly not financial fools.
US PUBLIC DEBT IS NOT A PROBLEM
There are two consequences to governmental over spending. They are out of control CPI inflation and currency collapse. Neither applies at present. And remember, federal government deficits are NOT funded with any new money.
So - calm down about the “terrible” problem of US Government debt. There is no problem. So — where is there a potential Debt Problem?
Private Debt is another matter altogether. The vast majority of it is generated by Commercial/Retail Bank loans which are collateralised by the real assets of a nation. When a bank loan is made, FRESH NEW money is created and this is the major source of such new money in a modern economy. The other source of fresh new money is Notes and Coins (Physical Cash) issued by the Treasury and distributed via the banking system in response to demand from the real economy. FRESH NEW money is necessary to replace the destruction of money that occurs when bank loans are paid off. And that occurs everyday. In other words, FRESH NEW money is like water for the economic garden and it has to be applied every day. Too much water will kill a garden. Too much private debt, especially if it is poorly invested, can kill an economy. As can too little.
However, US Private Debt is now falling as a Percentage of Nominal GDP. There is no need to panic about debt in the US economy at present. This chart shows the Peaks of US Private Debt in 2008 (from the rampant US banking fraud that culminated in the Global Financial Crisis) and in 2021 (from the over-reaction to the Covid Planned Case Demic “crisis”) and the subsequent fall since then. This chart is THE most important chart to take not of in April 2025.
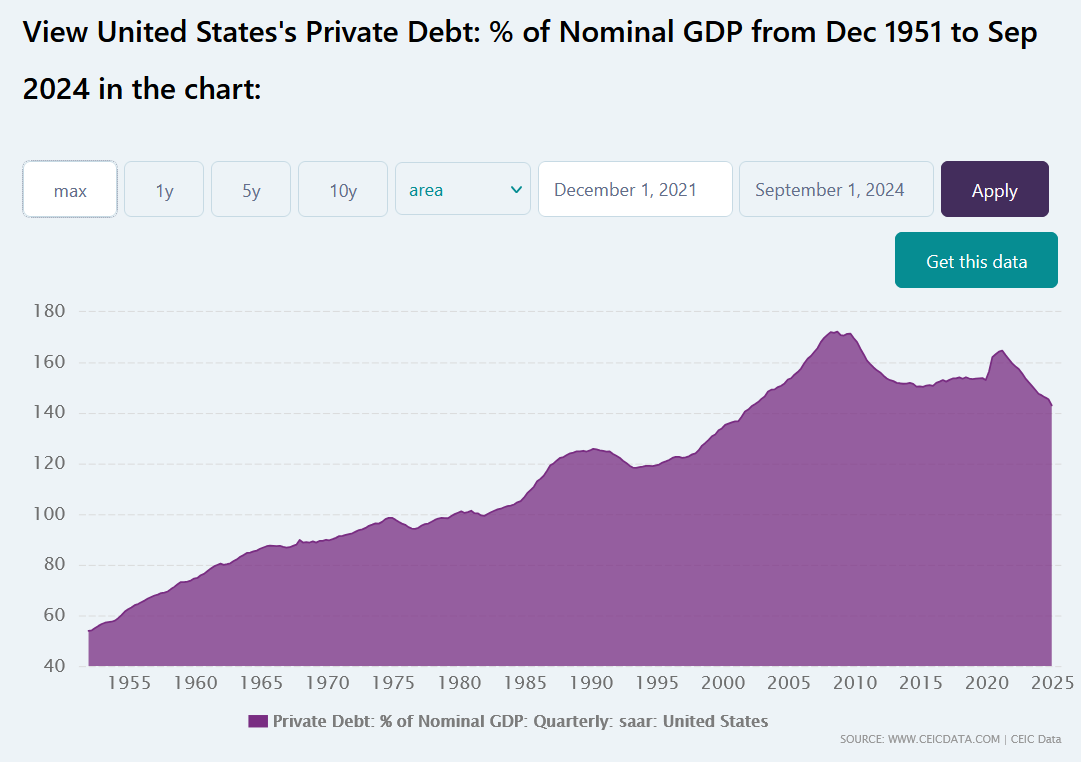
And here is the chart over the last 10 years — RELAX and send this article to Elon and Donald and Scott (Bessent).
Oh ….. and tell them to relax about US Government Debt.

THE POWER OF ITALY
BOOM wrote about the crucial power of Christian Italy on March 23rd – just 4 short weeks ago – under the banner -- ITALY NON-COMPLIANT.
BOOM was the first correspondent, globally, to draw attention to this matter.
“There is one big problem with the fascist plan of the “Willing” and that problem is Italy -- the centre of the Christian world in Europe and its third largest economy. Georgia Meloni, the Prime Minister of Italy, is not playing ball. She refuses to be part of the “Coalition of the Willing”. She will not send her troops into danger in Ukraine. So Christian Italy is a definite speed bump to the Great Plan along with Christian Hungary and Christian Slovakia.”
Georgia Meloni visited the White House on Thursday and made it clear that Italy is going to make its own way in the world and will not be dictated to by the fascists in the European Commission, headed by the unelected German Ursula Von Der Leyen and the unlikable and war-mongering Estonian, Kaja Kallas, the current EU Foreign Minister.
The result is that most of the leaders of Western Europe and the UK have now isolated themselves in their bunkers, opposed to any Peace agreements in Ukraine and seemingly intent on fighting a “100 year war” with Russia. This position is, of course, unwise in the extreme and will be opposed by the Southern Christian nations of Italy, Spain, Slovakia, Hungary, Slovenia and last but not least, the Trump led United States Government.
Georgia Meloni has understood who the enemy is in Europe and where it is contained within the European Commission, the European Union, the UK and the deluded, fascist elements therein.
Meanwhile, as if to highlight this situation, on Thursday, Ursula Von Der Leyen made this extreme statement --
“The West as we knew it no longer exists,” she said. “The world has become a globe also geopolitically, and today our networks of friendship span the globe, as you can see in the debate about tariffs.”
THAT is a disturbing and rather grand statement from the leader of the European Union. She is willing to throw Western Civilisation onto a bonfire of death. She is seeking to abandon the EU relationship with the United States. Is she another mad German forming a “coalition of the “Willing” to repeat the events of 1939? Or is she following orders?
Hopefully, that won’t happen and the fascists who have exerted so much power in Western Europe and the UK since the end of World War Two will have been defeated without a single shot in the Geopolitical standoff. Meloni and Trump understand the historical importance of this.
TRUMP’S TARIFF STRATEGY
However, Trump is now making a serious Geopolitical mistake. He does not understand Tariffs and the damage he has caused over the last few weeks. He is now threatening nations to “choose between the US and China”. This is the proposition of scoundrels. “You are either with us or against us” is the standard operating procedure of bullies and criminal thugs. America should stand above such a divisive strategy. Trump still has a lot to earn about Diplomacy. He even threatened China with “secret destructive weapons” if they “don’t make a deal”. He referred to "the most powerful weapons in the world." All BOOM can say about that statement is …... Sigh ……..
A great, prosperous, peaceful future cannot be built on Threats.
Then White House science adviser Michael Kratsios made a speech in which he said that the US has advanced weapons technology, some that can "manipulate time and space". Why would anyone make such a statement other than to use it as some sort of threat? Ridiculous.
Readers can review what BOOM wrote about unwise “Threat Ideology “ in last week’s editorial. Check the archive for “The Tariff War is Over”.
BOOM Archive:
https://boomfinanceandeconomics.substack.com/archive
==============================================================
In economics (and finance), things work until they don’t. Do your own research. Make your own conclusions. BOOM does not offer investment advice.
Disclaimer: All content is presented for educational and/or entertainment purposes only. Under no circumstances should it be mistaken for professional investment advice, nor is it at all intended to be taken as such. The commentary and other contents simply reflect the opinion of the authors alone on the current and future status of the markets and various economies. It is subject to error and change without notice. The presence of a link to a website does not indicate approval or endorsement of that web site or any services, products, or opinions that may be offered by them.
Neither the information nor any opinion expressed constitutes a solicitation to buy or sell any securities nor investments. Do NOT ever purchase any security or investment without doing your own and sufficient research. Neither BOOM Finance and Economics.com nor any of its principals or contributors are under any obligation to update or keep current the information contained herein. The principals and related parties may at times have positions in the securities or investments referred to and may make purchases or sales of these securities and investments while this site is live. The analysis contained is based on both technical and fundamental research.
Although the information contained is derived from sources which are believed to be reliable, they cannot be guaranteed.
Disclosure: We accept no advertising or compensation, and have no material connection to any products, brands, topics or companies mentioned anywhere on the site.
Fair Use Notice: This site contains copyrighted material the use of which has not always been specifically authorized by the copyright owner. We are making such material available in our efforts to advance understanding of issues of economic and social significance. We believe this constitutes a ‘fair use’ of any such copyrighted material as provided for in section 107 of the US Copyright Law. In accordance with Title 17 U.S.C. Section 107, the material on this site is distributed without profit. If you wish to use copyrighted material from this site for purposes of your own that go beyond ‘fair use’, you must obtain permission from the copyright owner.
Subscribe to BOOM Finance and Economics Substack
BOOM has developed a loyal readership which includes many of the world’s most senior economists, central bankers, fund managers and academics.
Thanks for reading BOOM Finance and Economics Substack! Subscribe for free to receive new posts and support my work.
https://open.substack.com/pub/grubstreetinexile/p/the-substack-guide-to-trolling-the?r=l1oox&utm_campaign=post&utm_medium=web&showWelcomeOnShare=false
# The Substack Guide to Trolling the Web. For Paul
# The Substack Guide to Trolling the Web
*Mostly Harmless*
## Part 1: Don't Panic, It's Just EROI
In which our protagonist encounters a mysterious commenter named Paul, who, like the Vogons of bureaucracy, insists on debating Energy Return on Investment (EROI) with all the charm of a poetry-reading session. The protagonist maintains a remarkably civil tone while explaining that EROI is based on measurable propositions, much like knowing where your towel is, but with more complicated math.
The protagonist notes, with Arthur Dent-like patience, that the dollar values might be abstract, but they're still better than trying to measure pure energy terms - rather like trying to measure the improbability of a whale spontaneously appearing in mid-air.
My BOOM on Jan 5th --- Climate Change Strategies have Failed over 35 Years - The Transition to Renewables is increasing Demand for Coal, Oil, Gas and Boosting CO2 Emissions - And Global GDP has Tripled - All part of a Plan? https://boomfinanceandeconomics.substack.com/p/climate-change-strategies-have-failed